dashboard hero

Smart Construction Dashboard Keeps Your Projects on Track Through Accurate Job Site Progress Visualization

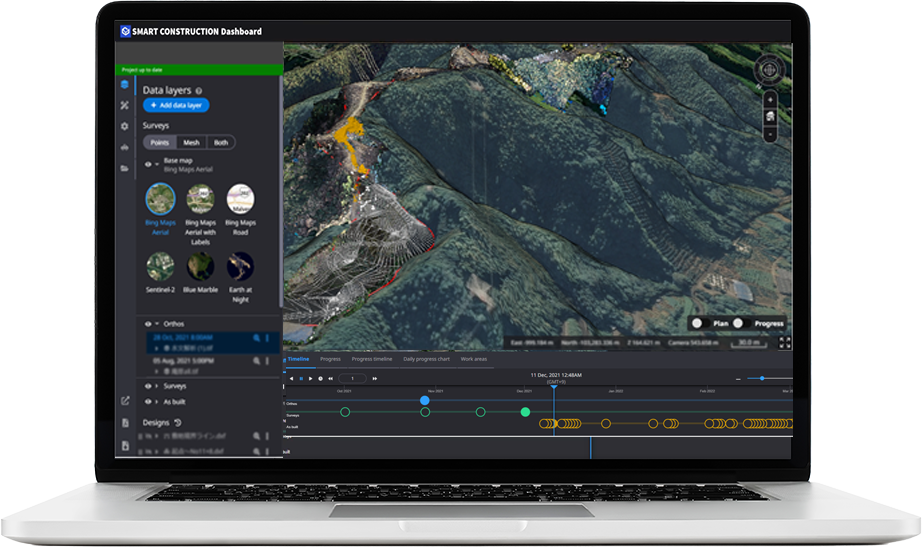
When measurements are wrong, you don't know how much material you'll need and you spend more time on paperwork than on the task at hand. Building a digital twin of your project with Smart Construction Dashboard enables job site visualization, improving decision-making capability and productivity.

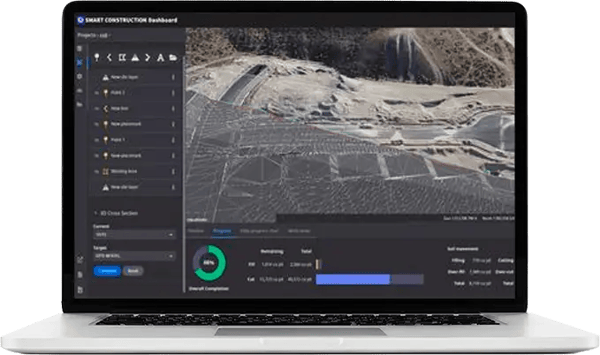
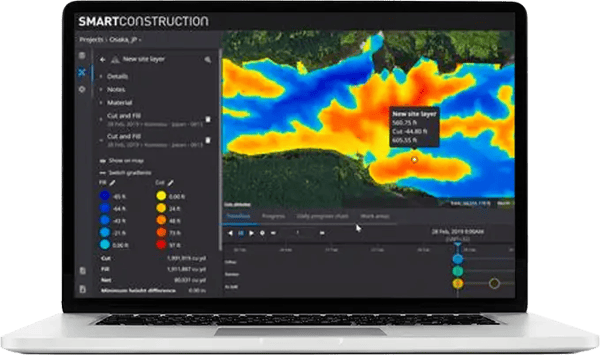
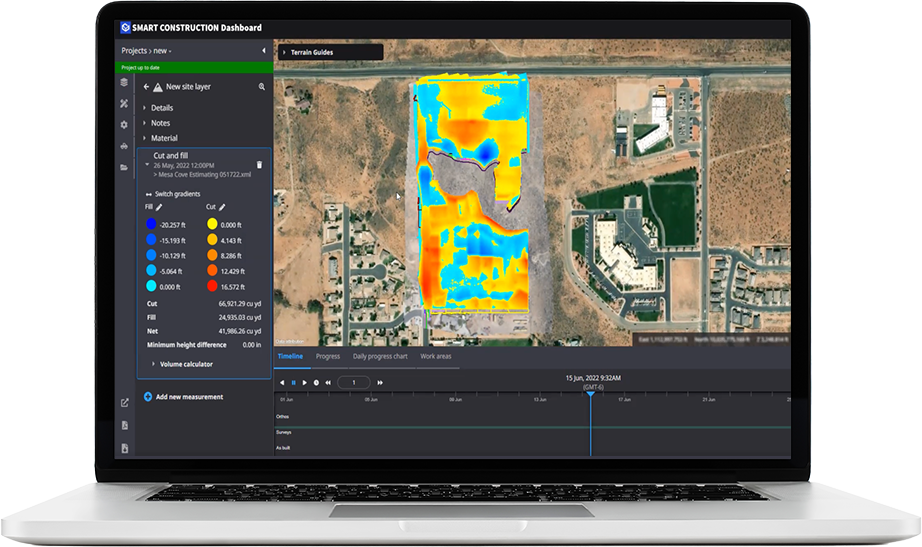
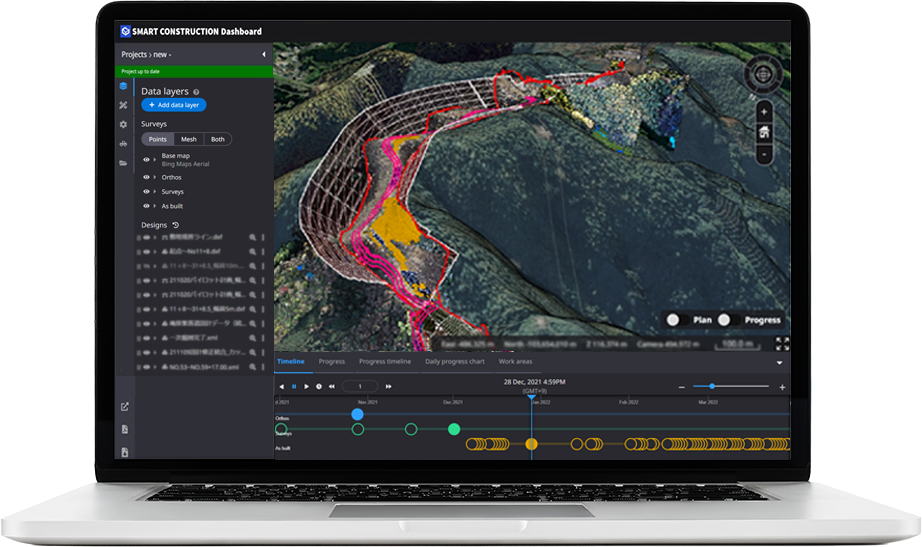
Smart Construction Dashboard removes the guesswork with easily generated cut/fill color mappings for visualization of material movements so everyone involved can easily understand the status of the site.

Watch How Dashboard Works

3D Job Site Visualization Where All Your Design, Drone, Terrain and Intelligent Machine Data Come Together

Visualize your data to know where you are today and make decisions on where you want to be tomorrow. Dashboard customers benefit from...

computer-dashboard-1
computer-dashboard-2
computer-dashboard-3
computer-dashboard-4
computer-dashboard-5
  • A 3D visualization of your job site that’s easy to use and understand.
  • 360° views of the design at every stage—past, present, and future.
  • Cloud-based portal to upload drone flights, designs and machine data to collaborate with key stakeholders.
  • Share visualizations with job owners at each stage to build trust and better partnerships.
  • Surface comparison data gathered daily from Komatsu Intelligent Machine Control and Smart Construction Retrofit machines or drones to check site progress and remaining earthwork volume on demand.
  • Easily generate industry-standard cut/fill color mappings for staff to visualize material movements and reporting.
  • Quantify volumetric production measurements for the whole site or defined areas of interest.

Make Key Decisions About Your Job Site Without Leaving the Office

SC_Dashboard

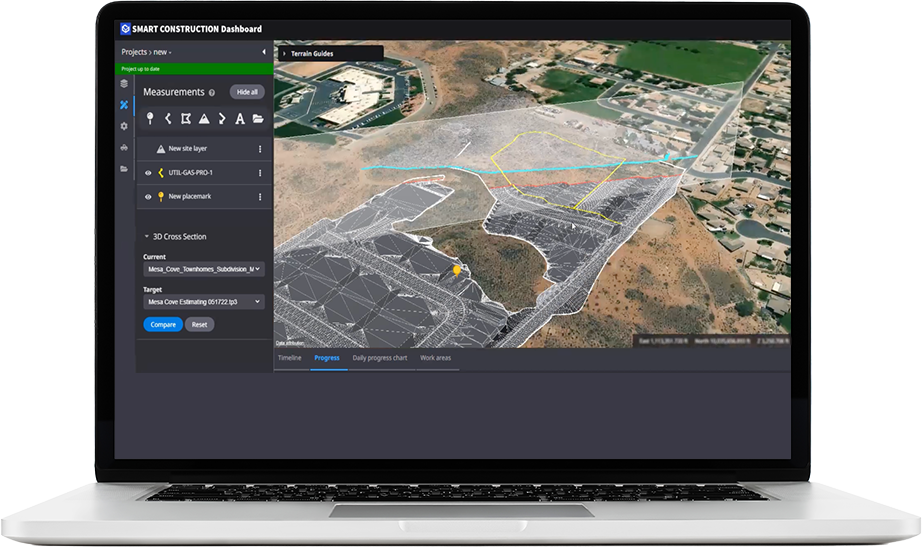
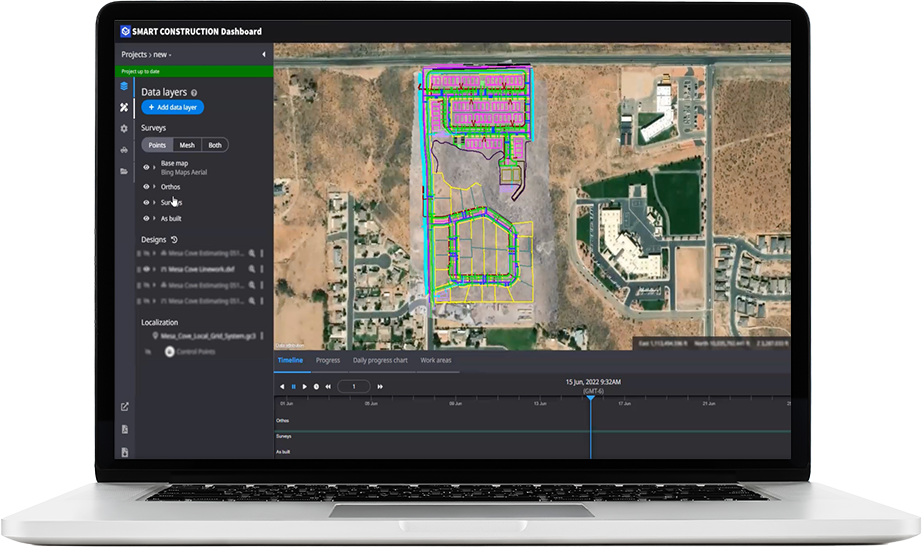
Smart Construction Dashboard is designed to be used daily by your operations manager, superintendent, drone pilot and project manager as the go-to solution for visualizing the status of the site. Having all this critical information in one place makes it easy for your team to make day-to-day decisions without ever having to be on-site. Spend more time on the projects that need your attention and less time trying to figure out which ones are in trouble.

connected lines

What Our Customers Say

Previously I had to manually measure each point I wanted to know, then upload it into a program, and finally calculate what I was measuring. With Smart Construction Dashboard, I can see all of the digital data on the job site quickly and can measure and evaluate many different things on the project. This saves me a significant amount of time and allows me to manage my job more effectively.’’

RYAN DOFELMIER

GPS LEAD/FIELD SUPPORT, NORTHWEST CONSTRUCTION, INC.

How Smart Construction Dashboard Helps You Through Every Phase of Your Project

Integrate data from multiple sources into one comprehensive picture so you can measure where you are today and make decisions about where you want to be tomorrow. By combining 3D design data with aerial mapping and intelligent machine data, you can confirm quantities and see progress each day.

Bidding/Pre-Construction Phase

Our survey tools and job site visualization application provide accurate time and cost calculations. Quickly understand job site quantities by comparing the existing terrain data with the engineer’s survey. No more guessing what material is going to be needed to complete the job. Let our staff instruct you on how to use the tools to maximize productivity.
dashboard-img-1
dashboard-img-2

Tracking Your Site(s)

Smart Construction Dashboard stores 3D data from your job sites, while color mapping provides for easy, ongoing comparisons of the initial terrain allowing you to calculate cut and fill in real-time. Know the status of the project in near real-time without leaving your office.

Contact Us

Contact Us

Have More Questions?

We would be happy to answer any questions you may have for us. Contact us today.